
CIS Home
Each function needs a sentence or two that clarifies the following:
What it does
What input parameters are expected to contain
What output parameter is expected to contain
What would indicate success or failure
What exception could be thrown by the function
Each part of code that isn't immediately obvious needs a sentence of explaination
Any interesting algorithm deserves a complete description.
Consider using - an open source documentation generator tool.
An assertion declares that a certain condition must be true at a specific point in a program.
The assertion is said to fail if the condition is false.
Assertions can tell why errors are happening.
Assertions can diagnose a problem at the first sign of trouble.
OK, what should I assert?
Short answer: everything!
Validate input parameters and check every assumption you made while writing your code.
Don't worry that putting in too many assertions degrades program performance: assertions usually active only in debug builds. Bug-finding opportunities outweigh the small performance hit!
IMPORTANT: Assertions should never change any variables or program state. Treat all data you check in assertions as read-only.
Tracing is a process of logging information about a program execution at run-time.
Trace statements allow to debug application without the debugger.
Tracing was the way most applications were debugged before interactive debuggers were invented.
The Unilog is an application-wide logging system, which enables to see a detailed view of program activity inside a running application.
Tracer tool inserts trace statements in every function of the Client application.
Instrumented Client source code is compiled.
Unilog Server is started before the Client.
The Server captures trace messages generated by the Client and creates a binary log file.
The Reader utility reads the information from the log file and generates a report (see sample report ).
Download file Unilog.zip and unzip the archive on your hard drive.
Partial Unilog directory structure includes a variety of tools:
Unilog\Tools directory contains DOS batch files to perform all unilog tasks.
Unilog\Tools\bin directory contains compiled versions of the unilog utilities:
ShowSymbols.exe - utility to display content of a symbol file.
UnilogReader.exe - the trace reader utility
UnilogServer.exe - the unilog server program
UnilogTracer.exe - the tracer utility
showtrace.bat - command file to display log files
unilog_trace_2_seq.exe conversion utility from the trace report into Alex Moffat's diagram ( sample ).
The following batch files can be used entirely inside the Microsoft Windows Explorer:
_01_unilog_start.bat.....start the server

_02_unilog_dir.bat.......list trace files in %TEMP%\UNILOG

_03_unilog_clean.bat.....remove trace files from %TEMP%\UNILOG

_04_unilog_insert.bat....drag and drop client directory to instrument the client

_05_unilog_display.bat...drag and drop client directory to generate trace_report.txt
                         and display it.
    NOTES:
    Report options are governed by the name of _unilog_[none/F/L/FS/LS/AS].txt file.
    See file content for details.
    Graphical report should not include S option (the source.)

_06_trace_display.bat....drag and drop trace_report.txt to generate the trace_report.png
                         and display it.
    NOTES:
    You may need to manually edit the _06_trace_display.bat to decide whether
    to include %COMPUTERNAME% in PNG file.
The server can be started by double-clicking the _01_unilog_start.bat.
The server window displays unilog> prompt.
Type ? to see available server commands:
unilog> ?
The following server commands are available:
     Log text message: t text
 Log checkpoint event: c
      Log alert event: a
  Create new log file: n
                 Quit: q
         Display help: ? or h
For example, try commands
unilog> t hello
unilog> c
unilog> a
The t command sends text message to the log file. The trace report should display an output like
1       ADDR |>  0xffffffff 2  hello
3       ADDR |>  0xffffffff 5 //Checkpoint//
4       ADDR |>  0xffffffff 6 !!Alert!!
The q command shuts down the server.
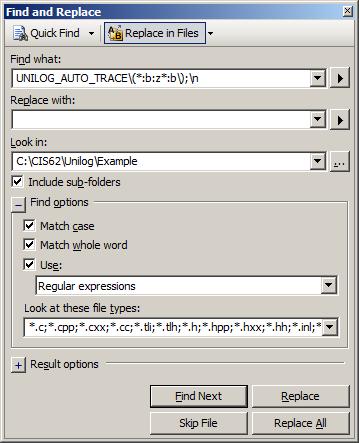
Before unilog can be used, the client source code must be instrumented.
Choose your own C++ project directory, then and drag and drop it on top of the _04_unilog_insert.bat in windows explorer.
All *.h and *.cpp will be instrumented.
(For other file extensions you may need to manually edit the _04_unilog_insert.bat batch file.)
In addition to the source instrumentation the symbols.txt is created in the client project directory.
Add the following directives on to each C++ source file in your project:
    #define UNILOG_TRACING_ON
    #include "../source/Server/UnilogClient.h"
(you may need to adjust the path to the UnilogClient.h.)
Add Server/UnilogClient.cpp file to the client project. Sometimes we can cheat by including it in one of the existing implementation files:
    #define UNILOG_TRACING_ON
    #include "../source/Server/UnilogClient.h"
    #include "../source/Server/UnilogClient.cpp"
Recompile the client.
#define UNILOG_TRACING_ON
#include "../source/Server/UnilogClient.h"
#include "../source/Server/UnilogClient.cpp"

void function_with_no_trace()
{
    // UNILOG_DISABLE_AUTO_TRACE is a macro to prevent automatic traces
    // inserted by the trace inserter utility.
    // Put this in your function as a first line of code to hint the
    // trace inserter that the function should not be modified:
    UNILOG_DISABLE_AUTO_TRACE;
}

int main()
{
    UNILOG_AUTO_TRACE( 1 );
    UNILOG_TRACE( "Example of UNILOG_TRACE message" );

    // You can create unique address-based variable named UNILOG_ID:
    DECLARE_UNILOG_ID;
    UNILOG_ID_TRACE( UNILOG_ID, "Example of UNILOG_ID_TRACE message" );
    UNILOG_ID_TRACE( 10, "Example of UNILOG_ID_TRACE message" );

    UNILOG_EVENT( UNILOG_BLOCK_TYPE_CHECKPOINT );
    UNILOG_EVENT( UNILOG_BLOCK_TYPE_ALERT );

    UNILOG_ID_EVENT( UNILOG_ID, UNILOG_BLOCK_TYPE_CHECKPOINT );
    UNILOG_ID_EVENT( UNILOG_ID, UNILOG_BLOCK_TYPE_ALERT );

    UNILOG_ID_EVENT( 10, UNILOG_BLOCK_TYPE_CHECKPOINT );
    UNILOG_ID_EVENT( 10, UNILOG_BLOCK_TYPE_ALERT );

    function_with_no_trace();
}
First, start unilog server by double-clicking on _01_unilog_start.bat.
Launch the client application.
Drag and drop the client directory on top of _05_unilog_display.bat. This generates trace_report.txt in the client directory and displays the result.
Next, try to drag and drop the trace_report.txt on top of _06_trace_display.bat. This generates a sequence diagram for your code execution.
Note: sequence tool is Java-based. You may need to edit the Unilog/Tools/config.bat to specify the correct location of Java\jdk1.6.X_XX\bin on your system.
Sample unilog-generated sequence diagrams can be found in Design Patterns presentation (also available in handout format.)
|
|
See also Unilog Architecture documentation.